# Reports
Our team is always finding the best way to present the information to you, that's why we will continue adding new reports and improving some of the existing ones.
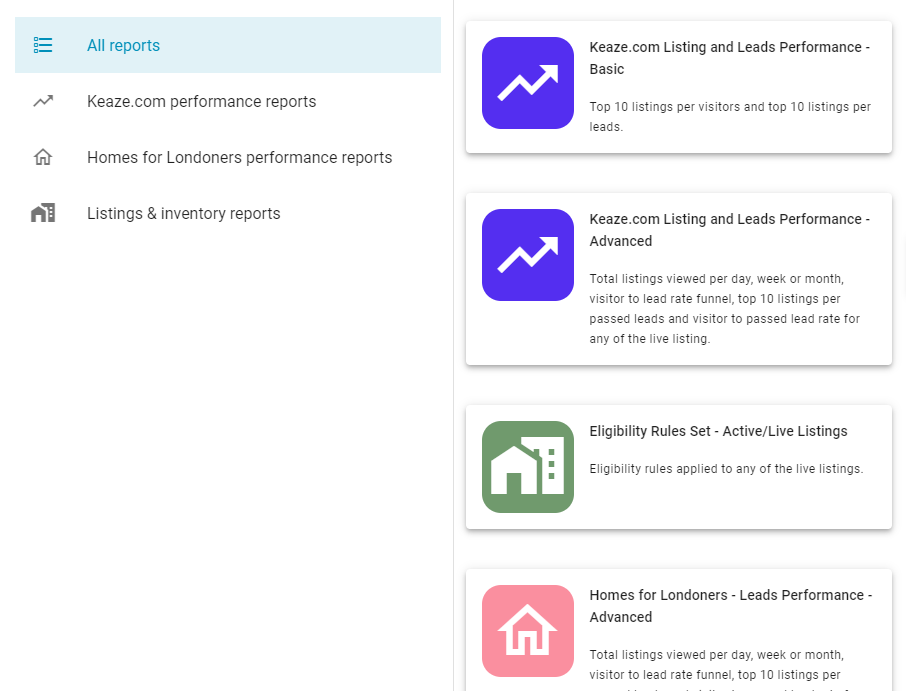
Reports are grouped in sections to help you find a specific report quicker, but you can list all available reports by clicking on the menu item 'All reports'.

When clicking on one report, the selected report will be rendered.
# Report viewer
On top of the report you can see the name and a brief description of the report. To come back to the list of report, click on the link to the right.

# Filters
Some reports can contain filters, which will be displayed just below the header panel. Most common filters are related to the period of time, in which case you can select one of the predefined period, or just select the option 'Custom range' and manually specify the period using the Date range component.

Depending on the report, you will be also able to group results daily, weekly or monthly, by using the three corresponding buttons.
# Sections
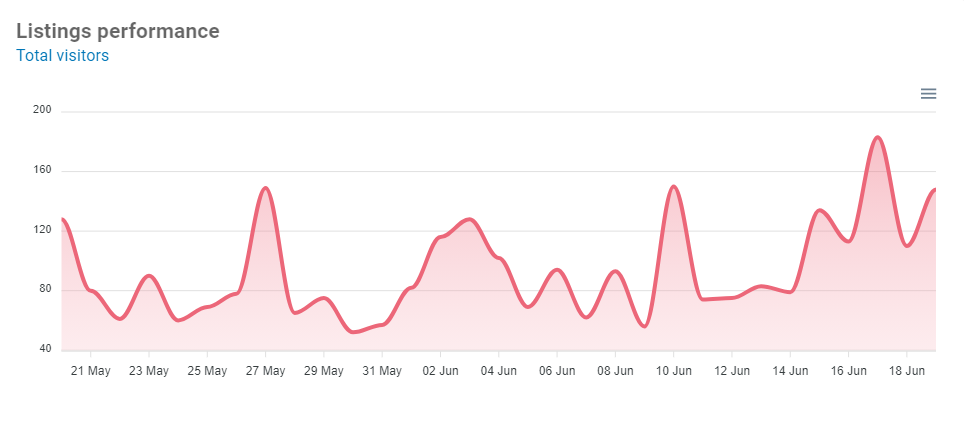
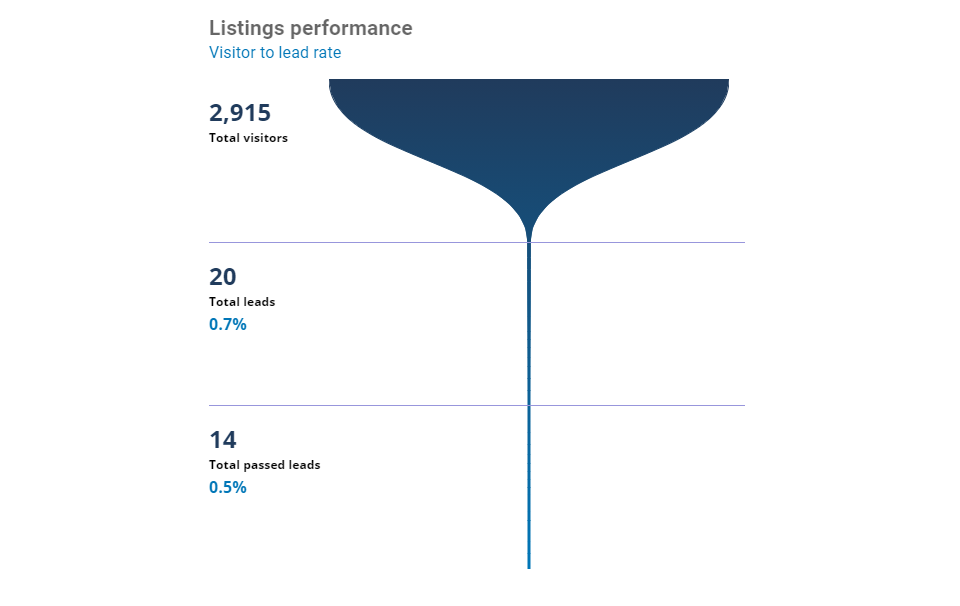
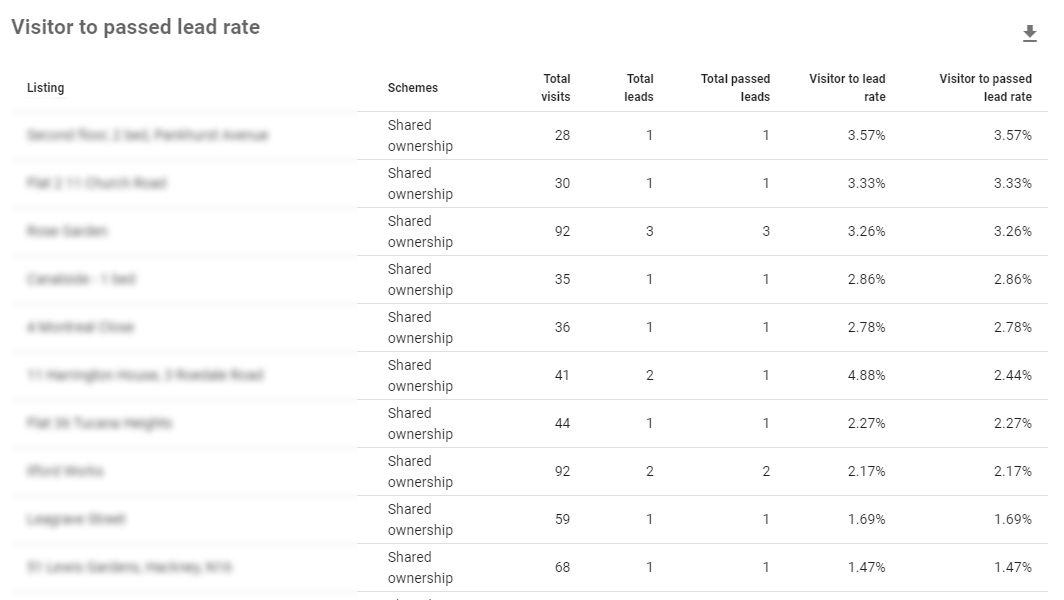
Report can contain multiple sections, where each section can display a chart, a funnel or a table.
Charts sections comprises line, area, column, bar and pie charts, and usually have a hamburger icon on the right with options to export the chart as an image.

Funnel sections contains a funnel chart, useful to illustrate the performance of the customer journey.

Table sections display tabular information, which can be downloaded as CSV files by clicking on the top right button.

